音声ファイル特徴量変換(その6)MFCC(TensorFlow)
TensorFlowでMFCC(Mel-Frequency Cepstral Coefficient)を求めるには、「tf.signal.mfccs_from_log_mel_spectrograms」関数が提供されている。
tf.signal.mfccs_from_log_mel_spectrograms | TensorFlow Core v2.1.0
インプットは、前回見た、「メルスペクトログラム(対数変換あり)」
使用する音声データは「yes」という一秒間の発話データ。

実行する環境は「TensorFlow 2.X」系
python -c 'import tensorflow as tf; print(tf.__version__)'
2.1.0
TensorFlow 1.X系のAPIを使ったコード
メルスペクトログラム(対数変換済み)を求めるまでは前回と同様。
import tensorflow as tf
from tensorflow.python.ops import io_ops

tf.compat.v1.disable_eager_execution()

# Audio Data
audio_path = 'speech_dataset/yes/0a7c2a8d_nohash_0.wav'

with tf.compat.v1.Session(graph=tf.Graph()) as sess:

    wav_filename_placeholder = tf.compat.v1.placeholder(tf.string, [])
    wav_loader = io_ops.read_file(wav_filename_placeholder)

    # audio: A Tensor of type float32.
    # sample_rate: A Tensor of type int32.
    wav_decoder, sr = tf.audio.decode_wav(wav_loader,
                                      desired_channels=1)

    # channelの次元を削除
    data_ = tf.squeeze(wav_decoder)

    # batch_sizeの次元を追加
    data__ = tf.expand_dims(data_, axis=0)

    # Input: A Tensor of [batch_size, num_samples]
    # mono PCM samples in the range [-1, 1].
    stfts = tf.signal.stft(data__,
                           frame_length=480,
                           frame_step=160,
                           fft_length=512)

    # 振幅を求める
    spectrograms = tf.abs(stfts)
    # --> Output shape: (1, 98, 257)

    # Melスケール変換用のMatrixを作成する
    linear_to_mel_weight_matrix = tf.signal.linear_to_mel_weight_matrix(
        num_mel_bins=128,
        num_spectrogram_bins=257,  # FFT size / 2 + 1
        sample_rate=16000,
        lower_edge_hertz=0.0,
        upper_edge_hertz=8000.0
    )

    # 行列積を求める
    mel_spectrograms = tf.tensordot(
        spectrograms,
        linear_to_mel_weight_matrix,
        1)

    # Compute a stabilized log to get log-magnitude mel-scale spectrograms.
    log_mel_spectrograms = tf.math.log(mel_spectrograms + 1e-6)
離散コサイン変換(DCT)を実行して、ケフレンシー(Quefrency)の次元に変換する。
    # Compute MFCCs from log_mel_spectrograms and take the first num_mfcc_bins.
    mfccs = tf.signal.mfccs_from_log_mel_spectrograms(log_mel)
DCTのタイプは「2」になる。
tensorflow/mfcc_ops.py at master · tensorflow/tensorflow · GitHub
Compute the DCT-II of the resulting log-magnitude mel-scale spectrogram.
The DCT used in HTK scales every basis vector by sqrt(2/N), which is the scaling required for an "orthogonal" DCT-II *except* in the 0th bin, where the true orthogonal DCT (as implemented by scipy) scales by sqrt(1/N).
For this reason, we don't apply orthogonal normalization and scale the DCT by `0.5 * sqrt(2/N)` manually.
スケーリングは以下の式になる。
「N」は「num_mel_bins」、メルスペクトログラムのbinの数にあたる(今回の例では「128」)
スケーリングを適用する処理のコード
# site-packages/tensorflow_core/python/ops/signal/mfcc_ops.py
def mfccs_from_log_mel_spectrograms(log_mel_spectrograms, name=None):
    ...
    dct2 = dct_ops.dct(log_mel_spectrograms, type=2)
    return dct2 * math_ops.rsqrt(
        math_ops.cast(num_mel_bins, dct2.dtype) * 2.0)
変換後、低次の係数を所定の個数分、取り出す(今回は「40」)
    n_mfcc_bin = 40
    mfccs_ = mfccs[..., :n_mfcc_bin]

    # セッションを実行する
    feature = sess.run(
        mfccs_,
        feed_dict={wav_filename_placeholder: audio_path}
    )
アウトプットの形状の確認。
print('feature shape: ', feature.shape)
print('feature type: ', type(feature))
feature shape:  (1, 98, 40)  # (batch_size, frame, num_mfcc_bins)
feature type:  <class 'numpy.ndarray'>
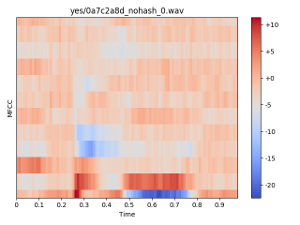
プロットしてみる。
import numpy as np
import librosa

# 次元を減らす(0次元目のbatch_sizeを除く)
feature_ = np.squeeze(feature)

# 次元を入れ替える (frame, cepstral_coef_index) --> (cepstral_coef_index, frame)
feature__ = feature_.transpose(1, 0)

# plot
import matplotlib.pyplot as plt
import librosa.display

librosa.display.specshow(feature__,
                         sr=16000,
                         hop_length=160,
                         x_axis='time')

plt.title('yes/0a7c2a8d_nohash_0.wav')
plt.ylabel("MFCC")
plt.colorbar(format='%+2.0f')
plt.tight_layout()
plt.show()

値の範囲を確認。
0番目の係数(直流成分)
print('Max Value(0-dim): ', np.max(feature[:,:,0]))
print('Min Value(0-dim): ', np.min(feature[:,:,0]))
Max Value(0-dim):  -20.868715
Min Value(0-dim):  -95.0319
1番目以降の係数
print('Max Value: ', np.max(feature[:,:,1:]))
print('Min Value: ', np.min(feature[:,:,1:]))
Max Value:  11.329892
Min Value:  -22.40368
0番目の係数(0th-Coefficent, 「C0」と表す)に関しては、実装によっては対数パワーに置き換えている。
https://python-speech-features.readthedocs.io/en/latest/
[python_speech_features.base.mfcc]
appendEnergy – if this is true, the zeroth cepstral coefficient is replaced with the log of the total frame energy.
係数の取り出し範囲を変更してみる。
1番目から127番目の係数(0番目の係数以外、全て)を取り出し
(右側は比較用としてメルスペクトログラム(対数変換あり))


1番目から39番目の係数を取り出し

1番目から12番目の係数を取り出し

「HTK」や「Kaldi」では、デフォルトで12番目までの係数を使う。
0番目の係数は使わず、対数パワーを加えた13次のデータを得る。
https://kaldi-asr.org/doc/feat.html
「HTK」では、deltat特徴量13次元、delta-delta特徴量13次元を加えた「39次元」をインプットとする。
音声認識メモ(Kaldi)その12(delta特徴量) - ichou1のブログ
「Kaldi」では、前後フレームの継ぎ合わせ(「splice」と呼ぶ)を行った「143」次元をインプットとする(「splice」を「5」とした場合)
https://work-in-progress.hatenablog.com/entry/2018/03/29/124545#feature_transform
TensorFlow 2.X系のAPIを使ったコード
単一ファイルから、データセット読み込みに変更する。
データセットは音声ファイル名とタグがペアで格納されているとする。
{'file': 'yes/0a7c2a8d_nohash_0.wav', 'label': 'yes'}import tensorflow as tf from tensorflow.python.ops import io_ops import numpy as np # Data Set candidates = [] candidates.append({'file': 'yes/0a7c2a8d_nohash_0.wav', 'label': 'yes'}) candidates.append({'file': 'yes/004ae714_nohash_1.wav', 'label': 'yes'}) candidates.append({'file': 'yes/00970ce1_nohash_0.wav', 'label': 'yes'}) candidates.append({'file': 'yes/00f0204f_nohash_0.wav', 'label': 'yes'})
タグはindexで扱えるよう、辞書を作成する。
# Label辞書を作る(word -> index)
label_dict = {}
for item in candidates:
    val = item['label']
    if not val in label_dict:
        label_dict[val] = len(label_dict)

# Label辞書を作る(index -> word)
inv_label_dict = {v: k for k, v in label_dict.items()}
データ読み込みは固定長にする。
(「desired_samples」を追加)
# Load Audio File
# INPUT : string
# OUTPUT: (sample_size, )
def load_data(filename):

    wav_loader = io_ops.read_file(filename)
    data, sr = tf.audio.decode_wav(wav_loader,
                                   desired_channels=1,
                                   desired_samples=16000)

    # channelの次元を削除
    data_ = tf.squeeze(data)

    return data_, sr
STFT、対数メルスペクトログラム、MFCCの計算をそれぞれ関数化する。
# compute STFT
# INPUT : (sample_size, )
# OUTPUT: (frame_size, fft_size // 2 + 1)
def get_stft_spectrogram(data, fft_size):
    # Input: A Tensor of [batch_size, num_samples]
    # mono PCM samples in the range [-1, 1].
    stfts = tf.signal.stft(data,
                           frame_length=480,
                           frame_step=160,
                           fft_length=fft_size)

    # 振幅を求める
    spectrograms = tf.abs(stfts)

    return spectrograms


# compute mel-Frequency
# INPUT : (frame_size, fft_size // 2 + 1)
# OUTPUT: (frame_size, mel_bin_size)
def get_mel(stfts, n_mel_bin):

    # STFT-bin
    n_stft_bin = stfts.shape[-1]          # --> 257 (= FFT size / 2 + 1)

    linear_to_mel_weight_matrix = tf.signal.linear_to_mel_weight_matrix(
        num_mel_bins=n_mel_bin,
        num_spectrogram_bins=n_stft_bin,
        sample_rate=16000,
        lower_edge_hertz=0.0,
        upper_edge_hertz=8000.0
    )
    # --> shape=(257, 128) = (FFT size / 2 + 1, num of mel bins)

    mel_spectrograms = tf.tensordot(
        stfts,                        # (1, 98, 257)
        linear_to_mel_weight_matrix,  # (257, 128)
        1)
    # --> mel_spectrograms shape: (1, 98, 128)

    # 対数を取る
    log_mel_spectrograms = tf.math.log(mel_spectrograms + 1e-6)

    return log_mel_spectrograms

# compute MFCC
# INPUT : (frame_size, mel_bin_size)
# OUTPUT: (frame_size, mfcc_bin_size)
def get_mfcc(log_mel_spectrograms, n_mfcc_bin):

    mfcc = tf.signal.mfccs_from_log_mel_spectrograms(log_mel_spectrograms)
    mfcc_ = mfcc[..., :n_mfcc_bin]

    return mfcc_
音声ファイルから特徴量を求めるWrapper関数。
# OUTPUT: (frame_size, mel_bin_size)
def get_feature(audio_path, fft_size, n_mel_bin, n_mfcc_bin):

    # 音声データ読み込み
    audio_data, sr = load_data(audio_path)

    # 特徴量(STFT)を求める
    stfts = get_stft_spectrogram(audio_data, fft_size)

    # 特徴量(対数メルスペクトログラム)を求める
    log_mel_spectrograms = get_log_mel(stfts, n_mel_bin)

    # 特徴量(MFCC)を求める
    mfcc = get_mfcc(log_mel_spectrograms, n_mfcc_bin)

    return mfcc
sample_count = len(candidates)
n_frame = 98
fft_size = 512
n_mel_bin = 128
n_mfcc_bin = 13

fingerprint_size = n_frame * n_mfcc_bin    # frame_size * mfcc_bin_size

# 初期化
data = np.zeros((sample_count, fingerprint_size))
labels = np.zeros(sample_count)

for idx, val in enumerate(candidates):

    feature = get_feature(val['file'], fft_size, n_mel_bin, n_mfcc_bin)
    data[idx, :] = tf.reshape(feature, [-1])  # flattens into 1-D
    labels[idx] = label_dict[val['label']]

data_ = tf.reshape(data, [sample_count, n_frame, n_mfcc_bin])
アウトプットの形状を確認する。
print(data_.shape)
print(labels.shape)
(4, 98, 13)  # (data_size, frame_size, mfcc_bin)
(4, )        # (data_size)
比較しやすいように、複数データをまとめてプロットしてみる。
# plot
import librosa
import matplotlib.pyplot as plt
import librosa.display
2行X2列に並べる。
# 2 x 2
num_row = 2
num_col = 2
speaker IDの取り出しを関数化する。
例えば「speech_dataset/yes/0a7c2a8d_nohash_0.wav」というファイルの場合、「0a7c2a8d」がspeaker IDに該当する。
# speaker IDを取り出す
def get_speaker_info(plot_sample_idx):
    file_path = candidates[plot_sample_idx]['file'].split('/')
    speaker = file_path[-1].split('_')
    return speaker[0]
カラーマップを固定化する。
# 指定されたindexのデータをプロットする
def plot_feature(plot_sample_idx):

    # 次元を入れ替える (frame, mfcc_index) --> (mfcc_index, frame)
    feature = tf.transpose(data_[plot_sample_idx], perm=[1, 0])

    # 0-thの係数は除く
    feature = feature[1:,:]
    feature_= feature.numpy()

    plt.subplot(num_row, num_col, plot_sample_idx+1)
    librosa.display.specshow(feature_,
                             sr=16000,
                             hop_length=160,
                             x_axis='time',
                             vmin=-20,
                             vmax=20,
                             cmap='jet')

    my_title = candidates[plot_sample_idx]['label']
    my_title += ' (' + get_speaker_info(plot_sample_idx) + ')'
    plt.title(my_title)
    cbar = plt.colorbar(format='%+2.0f')
    plt.ylabel('MFCC')
    plt.tight_layout()
順次、プロット。
plot_feature(0)
plot_feature(1)
plot_feature(2)
plot_feature(3)

plt.show()
プロット結果。
全て「yes」の発話。カッコ内は話者ID。

比較用に、同じデータに対する対数メルスペクトラムをプロットしたものが下図。
